
CAC Breakdown
What Customer Acquisition Cost includes, how it is commonly calculated, and why blended vs. channel-level CAC tell different stories.
ferabom explains how Customer Acquisition Cost (CAC), Lifetime Value (LTV) and the ratios built from them reveal whether a business model is sustainable — in plain language, with visual examples.
Educational content only — ferabom does not sell software, subscriptions, or any paid services.
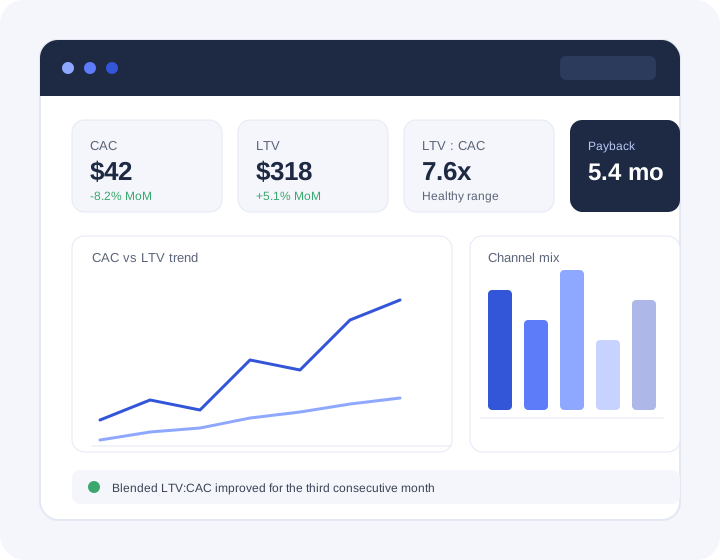
A short guide to the numbers that matter most when evaluating whether growth is efficient and sustainable.
What Customer Acquisition Cost includes, how it is commonly calculated, and why blended vs. channel-level CAC tell different stories.
An overview of Lifetime Value modeling approaches, from simple margin-based formulas to cohort-based projections.
Why grouping customers by signup period helps reveal retention trends that blended averages tend to hide.
How long it typically takes to recover acquisition costs, and the benchmarks often referenced across industries.
Concepts for comparing acquisition channels side by side using efficiency ratios rather than raw volume alone.
An introduction to how CAC and LTV trends feed into simple, informational forecasting exercises.
General industry reference points shared for educational context — actual healthy ranges vary widely by business model, market and stage.
The same three-step approach used throughout our educational materials.
Marketing and sales spend, revenue per customer, gross margin and retention data over a consistent period.
Derive CAC, LTV, the LTV:CAC ratio and payback period using consistent, well-documented formulas.
Benchmark the results against industry reference ranges and look for trends across cohorts and channels.

Revenue growth alone does not indicate a healthy business. Understanding CAC and LTV side by side helps separate efficient, durable growth from spending that quietly erodes margins.
Reach out with questions about the concepts covered on this site — we are happy to point you toward the right resources.